![]() ___________________________________________________________________________________________________________ ____________________________________________________________________________________________________________________ P C M O F M O N T A N A 4 0 6 . 3 8 8 . 1 5 4 5 ![]() |
|
CORN - Balance sheet |
Release Date: Friday July 11, 2025 |
Item | USDA | 2024/2025 | 2025/2026 | 2025/2026 | 2025/2026 |
START | Supply/Demand | prev | Jul 11 | prev | Jul 11 |
Planted | Acres Planted ma | 90.6 | 90.6 | 95.3 | 95.2 |
Harvested | Acres Harvest ma | 82.9 | 82.9 | 87.4 | 86.8 |
acre | Yield per Acre | 179.3 | 179.3 | 181.0 | 181.0 |
Beginning stocks | Begin Stocks | 1,763 | 1,763 | 1,365 | 1,340 |
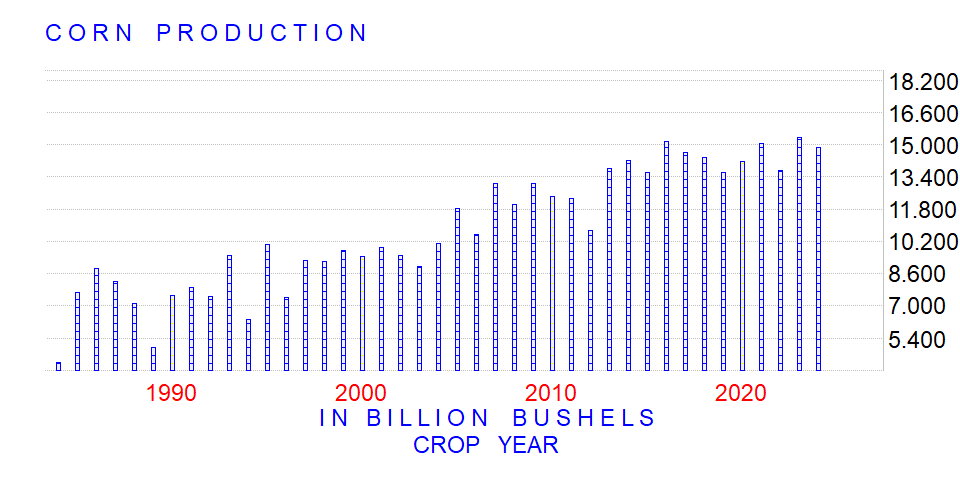
production | Production | 14,867 | 14,867 | 15,820 | 15,705 |
Imports | Imports | 25 | 25 | 25 | 25 |
Supply, total | Total Supply | 16,655 | 16,655 | 17,210 | 17,070 |
Feed and residual | Feed & Residual | 5,750 | 5,675 | 5,900 | 5,850 |
Food, seed & industrial 2/ | Food-Seed-Indust | 6,890 | 6,890 | 6,885 | 6,885 |
Ethanol & by-products 3/ | Ethonal | 5,500 | 5,500 | 5,500 | 5,500 |
Domestic, total | Tot Domestic Use | 12,640 | 12,565 | 12,785 | 12,735 |
Exports | Exports | 2,650 | 2,750 | 2,675 | 2,675 |
Use, total | Total Use | 15,290 | 15,315 | 15,460 | 15,410 |
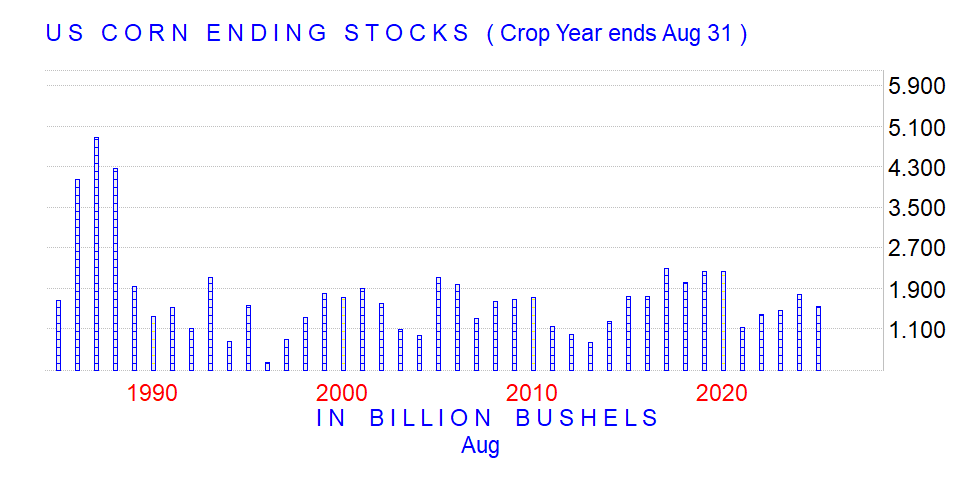
Ending stocks, total | End Stocks | 1,365 | 1,340 | 1,750 | 1,660 |
![]() |
![]() |
DISCLAIMER: This information is not to be construed as an offer to sell or a solicitation or an offer to buy the commodities herein named. The factual information of this report has been obtained from sources believed to be reliable, but is not necessarily all-inclusive and is not guaranteed as to the accuracy, and is not to be construed as representation by our firm. Past performance isnot indicative of future results. |